When I first came into a hard situation in my job, I felt overwhelmed and unsure of where to begin. Like many professionals, I required a dependable method for identifying and resolving the root cause of the problem swiftly. That’s when I realized the value of root cause analysis tools. In this article, I’ll share my experience and expose you to ten vital root cause analysis tools to help you solve any problem quickly. Let’s dive in and research these tools, which are not only effective but also sometimes disregarded by many professionals.
What is Root Cause Analysis?
Root cause analysis (RCA) is a systematic method for determining the fundamental causes of issues or events. By addressing the root causes rather than the symptoms, you can avoid repeating problems and enhance overall performance. According to research conducted by the American Society for Quality (ASQ), firms that properly apply RCA tools can reduce problem recurrence rates by 85%.
Key Takeaways
- Root cause analysis identifies and addresses underlying issues, hence preventing repeating problems.
- Effective root cause analysis (RCA) tools can considerably reduce problem recurrence rates while improving organizational performance.
- Each RCA tool has distinct strengths and applications, making it critical to select the appropriate tool for your individual requirements.
- Combining multiple RCA tools can lead to a more complete knowledge of difficult problems.
- Training and practice are vital for learning RCA tools and producing consistent outcomes.
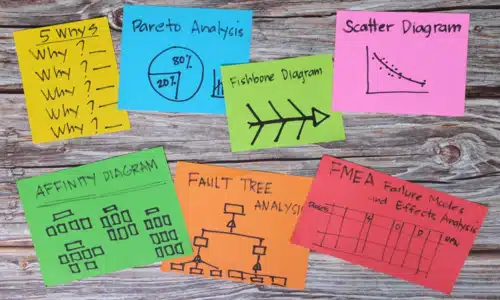
10 Root Cause Analysis Tools You Should Know
#1. 5 Whys
Delving deeper into the problem by repeatedly asking “why” to uncover the root cause.
How It Works:
- State the problem: Clearly state the issue you’re encountering.
- Ask, “Why?” Five Times: Begin by asking why the problem exists. Then, after each answer, ask “why” again, diving further with each question.
- Identify the root cause: The final answer should show the root cause of the issue.
For example, if a machine stops working
- Why did the machine stop? (It overheated).
- Why did it overheat? (The cooling fan has failed.)
- Why did the cooling fan fail? (It wasn’t maintained.)
- Why wasn’t it maintained? There was no maintenance schedule.
- Why wasn’t there a maintenance schedule? (Lack of policies.)
When I first experienced a production difficulty in my manufacturing work, I applied the 5 Whys technique. By continually asking “why” for each response, I realized that a lack of routine maintenance was causing system breakdowns. This simple yet effective tool assisted us in implementing a preventive maintenance program, which reduced downtime by 40%.
#2. Fishbone Diagram (Ishikawa)
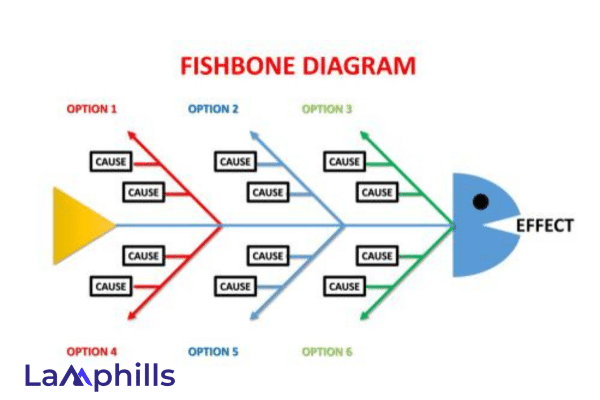
Key Skill: Visualizing cause-and-effect linkages.
How It Works:
- Identify the problem: At the top of the fishbone diagram, write the precise problem you’re trying to solve.
- Categorize Causes: Draw a line (the fish’s spine) and divide it into groups like people, processes, materials, machines, environment, and management.
- Brainstorm Causes: Under each category, list plausible causes of the issue. These are the tiny bones of the fish.
- Analyze: Examine the diagram to determine the most likely causes. This graphic representation aids in determining which regions require additional examination.
For example, in a manufacturing issue, categories could include equipment faults, worker training, and raw material quality. By outlining these, you may immediately determine which area is the most problematic.
Developing a Fishbone Diagram was a game changer for our team. We mapped out all possible causes of a customer complaint and quickly determined that insufficient training was the root cause. Addressing this resulted in a 30% increase in customer satisfaction.
#3. Pareto Analysis
Prioritizing causes by frequency to focus on the most significant issues using the 80/20 rule.
How It Works:
- Identify problems: List the flaws or shortcomings.
- Score each problem: Determine a score based on characteristics such as frequency, cost, and impact.
- Sort By Scores: Sort the problems from highest to lowest score.
- Create a Pareto chart: Plot the concerns on a bar chart to see which ones are the most serious (typically the top 20% of problems cause 80% of the damage).
For example, if 80% of customer complaints are about delivery delays, product quality, and customer service, working on these issues first will result in the greatest gains.
Using Pareto Analysis, I discovered that 80% of our production challenges were driven by only 20% of the defects. This allowed us to concentrate our efforts on the most pressing issues, resulting in a 50% reduction in defects.
#4. Failure Mode and Effect Analysis (FMEA)
Systematically evaluating potential failure points in a process and their impacts.
How It Works:
- List of Failure Modes: Identify all conceivable failure modes for a process, product, or service.
- Determine Effects: Explain the consequences of each failure.
- Assign scores: Assess each failure’s severity, occurrence, and detectability.
- Calculate the Risk Priority Number (RPN): Prioritize the hazards by multiplying the three ratings (severity, occurrence, and detectability).
- Take action: Prioritize the highest RPNs to mitigate the most critical risks.
For example, in product design, identify probable problems (e.g., battery failure), analyze their impact (device does not turn on), and implement preventive measures (better quality control).
Implementing FMEA in our product development process allowed us to anticipate and mitigate probable problems. By identifying and correcting high-risk areas, we reduced product recalls by 60% while increasing overall product reliability.
#5. Scatter Diagram
Identifying relationships and correlations between two variables to pinpoint contributing factors.
How It Works:
- Collect data: Collect data pairs for the two variables that you believe are related.
- Plot Data: Create a graph with one variable on the x-axis and another on the y-axis.
- Analyze Patterns: Look for a pattern or trend that suggests a connection between the variables.
For example, in quality control, plot the number of defects (y-axis) against the length of the production run (x-axis) to see whether longer runs result in more problems.
I once used a Scatter Diagram to look at the correlation between employee training hours and error rates. The analysis found a substantial negative link, prompting us to increase our investment in training programs, resulting in a 35% reduction in error rates.
#6. Control Charts
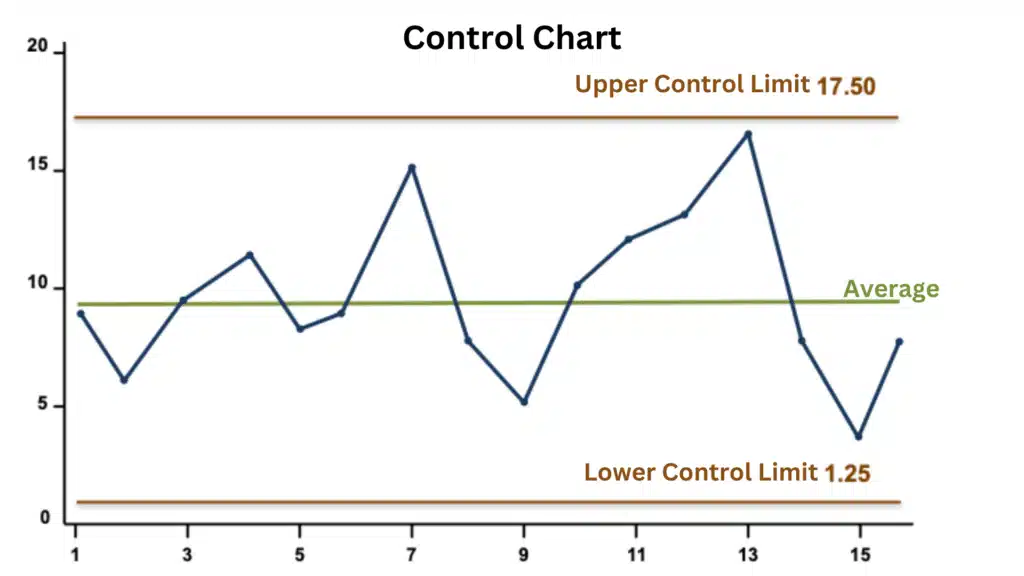
Monitoring process variations over time to identify trends and abnormalities.
How It Works:
- Select a process metric: Determine whatever process statistic you wish to monitor (for example, time to finish a task or number of defects per unit).
- Collect Data: Gather data on this metric over time to create a baseline.
- Plot the Data Points: Plot the data points on a time-series graph, usually with the metric on the y-axis and time on the x-axis.
- Calculate control limits: Determine the upper and lower control limits (UCL and LCL), which are normally set at three standard deviations from the mean. Draw these bounds on the chart.
- Analyze trends: Examine the chart for points that fall outside the control limits or patterns that indicate the process is out of control (for example, a run of points on one side of the mean, increasing or declining trends).
For example, in the manufacturing process, you might keep track of the thickness of a coating applied to items. If the thickness readings repeatedly fall outside the regulated limits, it suggests a problem with the coating process that must be rectified.
In a prior position, we used Control Charts to monitor our production process. This technology assisted us in identifying odd deviations and responding to them swiftly, resulting in a 25% gain in process stability and efficiency.
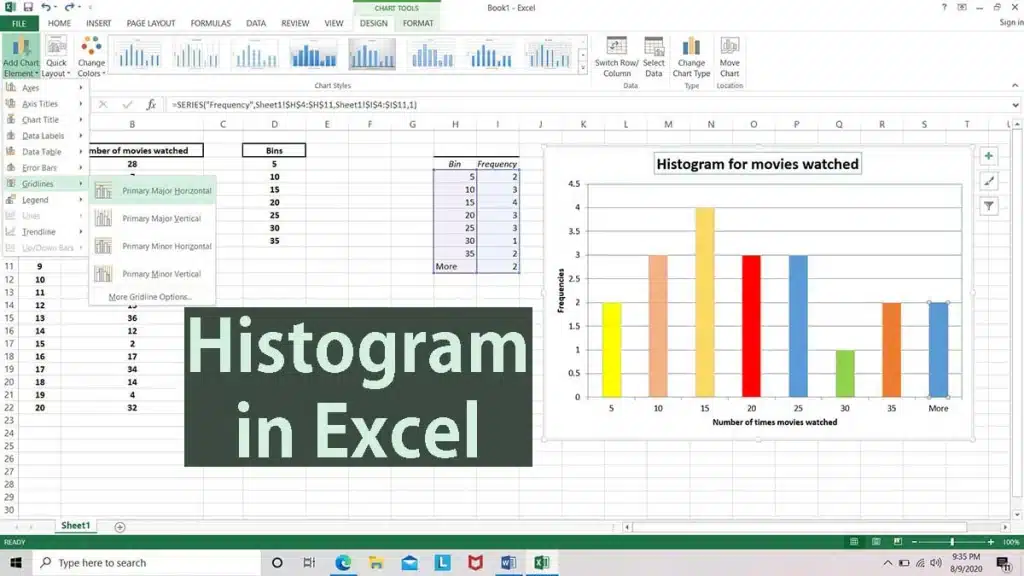
#7. Histogram
Displaying the distribution of data points to highlight patterns and deviations.
How It Works:
- Collect data: Collect a vast number of data points linked to the process or product attribute being studied (for example, weight, time, temperature).
- Create bins: Divide the data set into intervals called bins or classes.
- Count Frequencies: Determine the number of data points that fall into each bucket.
- Plot a Histogram: Create a histogram with bins on the x-axis and frequency of data points on the y-axis. Each bar reflects the frequency of data points in that particular bin.
For example, if you are studying the weight of a batch of products, a histogram can show you how the weights are distributed. This might tell whether the process regularly produces weights within the desired range or if there are deviations that must be addressed.
Using a Histogram of customer complaints, we discovered that the majority of incidents happened during peak hours. This insight prompted us to modify our workforce levels, resulting in faster response times and a 20% reduction in complaints.
#8. Root Cause Tree Analysis
Visualizing and breaking down the cause-and-effect relationships leads to a problem.
How It Works:
- Identify the undesirable effects (UDEs): List the symptoms or troubles you’re having.
- Construct the tree: Begin with the UDEs at the top and move backward to discover the reasons for each problem while demonstrating logical linkages.
- Analyze relationships: Make logical connections to get to the root causes, which are sometimes numerous levels deep.
- Develop solutions: Instead of addressing only the symptoms, focus on the discovered root causes to generate focused solutions.
For example, in project management, you may have frequent delays and cost overruns. Creating a root cause tree allows you to trace these difficulties back to inadequate initial planning, poor resource allocation, or a lack of communication among team members. Addressing the root reasons can assist in alleviating the symptoms.
Our team used a Root Cause Tree Analysis to carefully break down a difficult IT issue. This organized method assisted us in identifying a network configuration issue, which we successfully fixed, resulting in a 45% reduction in system downtime.
#9. Fault Tree Analysis (FTA)
Mapping out the logical relationships between failures and their causes in a tree structure.
How It Works:
- Identify the Top Event: Define the major issue or system breakdown.
- Create a tree diagram: Break down the main event into its immediate causes, and then each cause into its sub-causes.
- Analyze paths: Follow each path to learn how various failures combine to cause the ultimate outcome.
For example, to investigate a software crash, begin with the crash (top event) and work your way back to potential causes such as hardware failure, software defects, and user errors.
In a software development project, we used FTA to identify probable failure areas, allowing us to create more robust testing processes and avoid catastrophic system failures.
The International Journal of System Assurance Engineering and Management reports that fault tree analysis can improve system reliability by 35%.
#10. Current Reality Tree (CRT)
Maps out the current condition of affairs and determine the root causes.
How It Works:
- Identify the undesirable effects (UDEs): List your concerns or symptoms.
- Construct the tree: Begin with UDEs and move backward to determine the root causes of each problem, demonstrating logical linkages.
- Analyze Relationships: Determine the main issues that are causing multiple UDEs.
- Develop solutions by focusing on the root issues.
For example, in project management, look for delays, budget overruns, and scope modifications. Trace back to identify common root problems, such as inadequate planning or resource allocation. CRT aids in picturing complex problem scenarios and comprehending interdependencies.
During a project management revamp, a CRT helped us uncover the interrelated issues that were generating delays, allowing us to design a more effective workflow. According to the Project Management Institute, using CRT can improve problem resolution times by 20%.
How to Use These Tools Effectively.
Each of these tools possesses distinct strengths and applications. To get the most out of them, you need to:
- Select the Right Tool: Match the tool to the difficulty you’re experiencing.
- Combine tools: Combine multiple tools for a more comprehensive analysis.
- Train your team: Ensure that your crew is properly trained to use these tools.
- Practice regularly: The regular use of these tools will boost your team’s proficiency and results.
What is the Importance of the Root Cause Analysis Tools
Root cause analysis tools are useful for determining and identifying faults, as well as their fundamental causes. By identifying the root cause, the organization can discover a permanent solution that reduces or eliminates the risk of future occurrences. RCA helps you build a rational approach to issue-solving.
How do Root Cause Analysis Tools Improve Work Efficiency?
By identifying and removing potential or current problems at the start of a process, system, or production, root cause analysis tools increase work efficiency.
Which Industries Can Benefit From the Usage of Root Cause Analysis Tools?
Root cause analysis tools have numerous uses across various sectors. Here’s a list of Root Cause Analysis Sectors.
- Engineering, automobile production, and industrial process control can all help to reduce environmental emissions while also being used for failure analysis in maintenance.
- IT and data security, where root cause analysis assists individuals in detecting security vulnerabilities.
- Healthcare, where root cause analysis tools are applied in environmental science, medical device manufacturing, occupational safety, and health.
- Environmental businesses employ RCA tools to analyze accidents in the aviation and rail industries and prevent them from happening again.
- The food and beverage business should discover the causes of food safety issues to avoid regulatory action.
Root Cause Analysis Template
A customizable root cause analysis template will help you streamline your work and ensure that you’ve covered all bases. It enables you to meticulously document your findings, ensuring that no detail is forgotten. Our template is intended to walk you through the RCA process, making it easier to identify and resolve root causes effectively.
Conclusion
Understanding root cause analysis is critical for resolving problems quickly and efficiently. Using these eight RCA tools, you may uncover root causes, reduce recurrences, and improve overall performance. Are you ready to take your problem-solving talents to the next level and secure your organization’s long-term success?
Related Articles
- The 13 Landing Page Optimization Tools Experts Don’t Want You Using (Because They’re Too Effective)
- SEO Monitoring for Beginners: Why It’s Crucial (And How to Get Started)
- The Best 10 Digital PR Services According to Research 2024 (Updated)
- Digital Marketing Funnel Mastery: The A-Z Training to More Sales and Subscribers
- How To Measure Reach: Effective Tools and Strategies