The sheer variety of metrics and KPIs (key performance indicators) that experts advised I track intimidated me when I first started dabbling in content marketing. I felt lost in a sea of numbers, unsure which ones were genuinely important. This handbook is for anyone who has ever felt the same way. Here, I’ll lead you through a beginner’s guide to content marketing KPIs and metrics, offering insights that most websites ignore as well as stories from my own experience. By the conclusion, you’ll understand how to measure what’s important and make data-driven decisions to enhance your content strategy.
What are Content Marketing KPIs and Metrics?
KPIs and metrics for content marketing are measurable data points used to measure the performance and effectiveness of your content marketing initiatives. They assist you in determining what is and is not working, as well as how you may modify your plan to meet your objectives.
Why are Content Marketing KPIs and Metrics Important?
Understanding and measuring the appropriate KPIs and metrics can significantly improve the success of your content marketing initiatives. They provide insights into your audience’s behavior, assist you in refining your plans, and justify your marketing budget to stakeholders.
When I first started tracking the success of my content, I included everything from page views to social shares. However, I quickly discovered that not all metrics were equally valuable. For example, a blog post with thousands of views but no conversions was less successful than one with fewer views but a greater conversion rate. This revelation helped me focus on the metrics that were relevant to my business objectives.
Things to Consider Before Selecting Your Content Marketing KPIs
Although it would have been extremely simple and useful, there is no magic formula for determining the content marketing KPIs that should be measured. To track and measure appropriate content marketing performance metrics, you must first determine what you want to achieve from your campaign, such as generating leads, increasing brand awareness, or improving search engine results.
Whatever the goal, once you’ve established SMART goals for your marketing strategy, you can easily align them with the appropriate KPIs.
Here are some important factors to consider when selecting your content marketing KPIs:
#1. Make sure to set the correct OKRs
OKR stands for Objectives and Key Results, and it is a framework for setting goals with measurable outcomes. KPIs are what help drive your OKRs, and they perform best when used together. For example, if a KPI result indicates that your website traffic is decreasing, your content team can set up an OKR target based on the key findings of an existing KPI.
#2. Ensure that your content marketing KPIs are relevant
Your content marketing goals should reflect and correlate with the company’s goals, and it should be apparent how they will relate to the organization’s long-term goals.
#3. Make sure your content marketing KPIs are realistic
When analyzing your existing content performance, you will receive a dose of reality that may not always be in line with your goals. Doubling your website traffic or getting 25 new backlinks to your blog sounds wonderful, but is it feasible to achieve in the next month? Perhaps, but most likely not.
#4. Make sure your goals and metrics are actionable
KPIs are at the forefront of decision-making, therefore your content staff must not only comprehend content marketing KPIs, but also be able to translate those KPIs into actionable next steps.
Content Marketing KPIs and Metrics: How to Use Them Effectively
To effectively use content marketing KPIs and metrics, you must first grasp the significance of each statistic and then act on the information it provides. Here’s a full breakdown of essential metrics and how to measure and apply them to improve your content strategy.
#1. Traffic Metrics
Page Views
This measure keeps track of how many times your pages have been visited. High page views suggest that your content is attracting attention. However, comparing page views to engagement metrics is critical for determining whether visitors are genuinely engaging with your content. If you have a lot of page views but little engagement or conversion, it’s time to rethink your content’s relevancy or value. To measure page views, use programs such as Google Analytics.
Unique Visitors
This term refers to the number of separate individuals who visit your website. This metric allows you to understand the reach of your content. Tracking unique visitors over time might reveal growth patterns and the efficacy of your content promotion activities. Google Analytics can simply track this metric, providing information about how many new and repeat visitors you have.
Sessions
Sessions represent the total number of visits to your website, including repeat visits from the same user. This measure allows you to better analyze total site traffic and visitor behavior. Analyzing sessions with unique visitors might help you determine whether your content encourages return visits. Google Analytics offers a detailed breakdown of sessions.
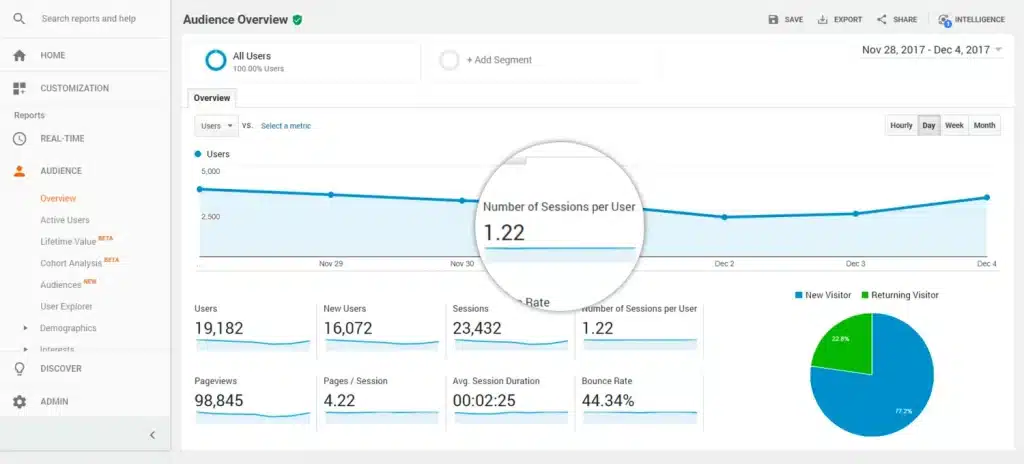
New vs. Returning Visitors
This indicator displays the ratio of new visitors to those that return to your website. A healthy balance implies that you are attracting new audiences while still retaining existing ones. Track these metrics using Google Analytics, and then adjust your content strategy to balance acquisition and retention.
Traffic Sources
Traffic sources indicate where your visitors originate, such as organic search, direct traffic, referrals, or social media. Understanding traffic sources allows you to determine the most successful channels for content distribution. Use this information to direct your marketing efforts toward the most effective channels. Google Analytics acquisition reports include precise traffic source information.
#2. Engagement Metrics
Average Time on Page
This metric measures the average amount of time visitors spend on a page. A greater average time indicates that your content is interesting and useful to users. Compare this measure across pages to see which sorts of content perform the best. This information is available in Google Analytics’ Behavior section.
Bounce Rate
The bounce rate is the percentage of visitors who abandon your website after reading only one page. A high bounce rate could suggest that your content isn’t engaging or relevant to the target audience. Aim to reduce bounce rates by boosting content quality and relevancy. Measure and examine bounce rates with Google Analytics.
Pages Per Session
This indicator represents the average number of pages viewed in a single session. More pages per session indicate that users are spending more time on your site, implying that it contains interesting content. Monitor this measure in Google Analytics to better understand user involvement.
Scroll Depth
Scroll depth measures how far down a page visitors may scroll. It lets you determine whether users are interacting with the complete content or just skimming the top. Set up scroll tracking with tools such as Google Tag Manager and evaluate the results to enhance content placement and structure.
Click-Through Rate (CTR)
CTR measures the percentage of visitors who click on a link or call-to-action (CTA) in your content. A high CTR shows that your content is compelling and your call-to-actions are successful. Measure CTR with Google Analytics and optimize engagement by adjusting CTAs and content placement.
#3. Conversion Metrics
Conversion Rate
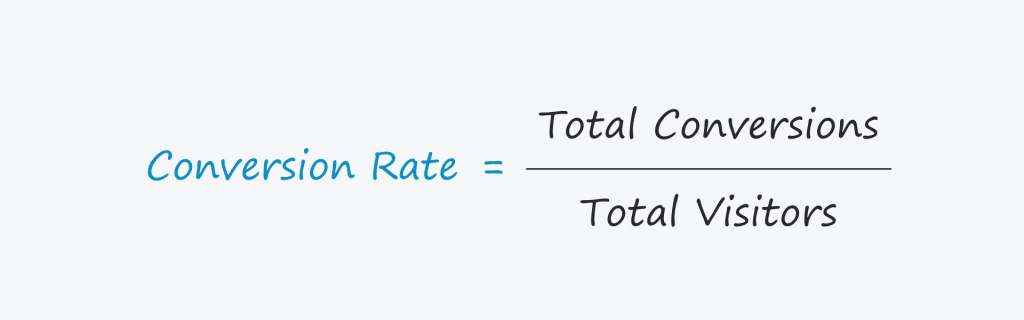
The conversion rate is the percentage of visitors who take the intended action, such as filling out a form or making a purchase. This statistic is critical for determining how effective content is at driving corporate goals. Use Google Analytics’ goal tracking to measure conversions and optimize your content to increase conversion rates.
Lead Generation
This indicator tracks how many new leads your content generates. Lead creation is critical for B2B marketers seeking to create a sales pipeline. Use CRM systems such as HubSpot to track and analyze lead-generating metrics.
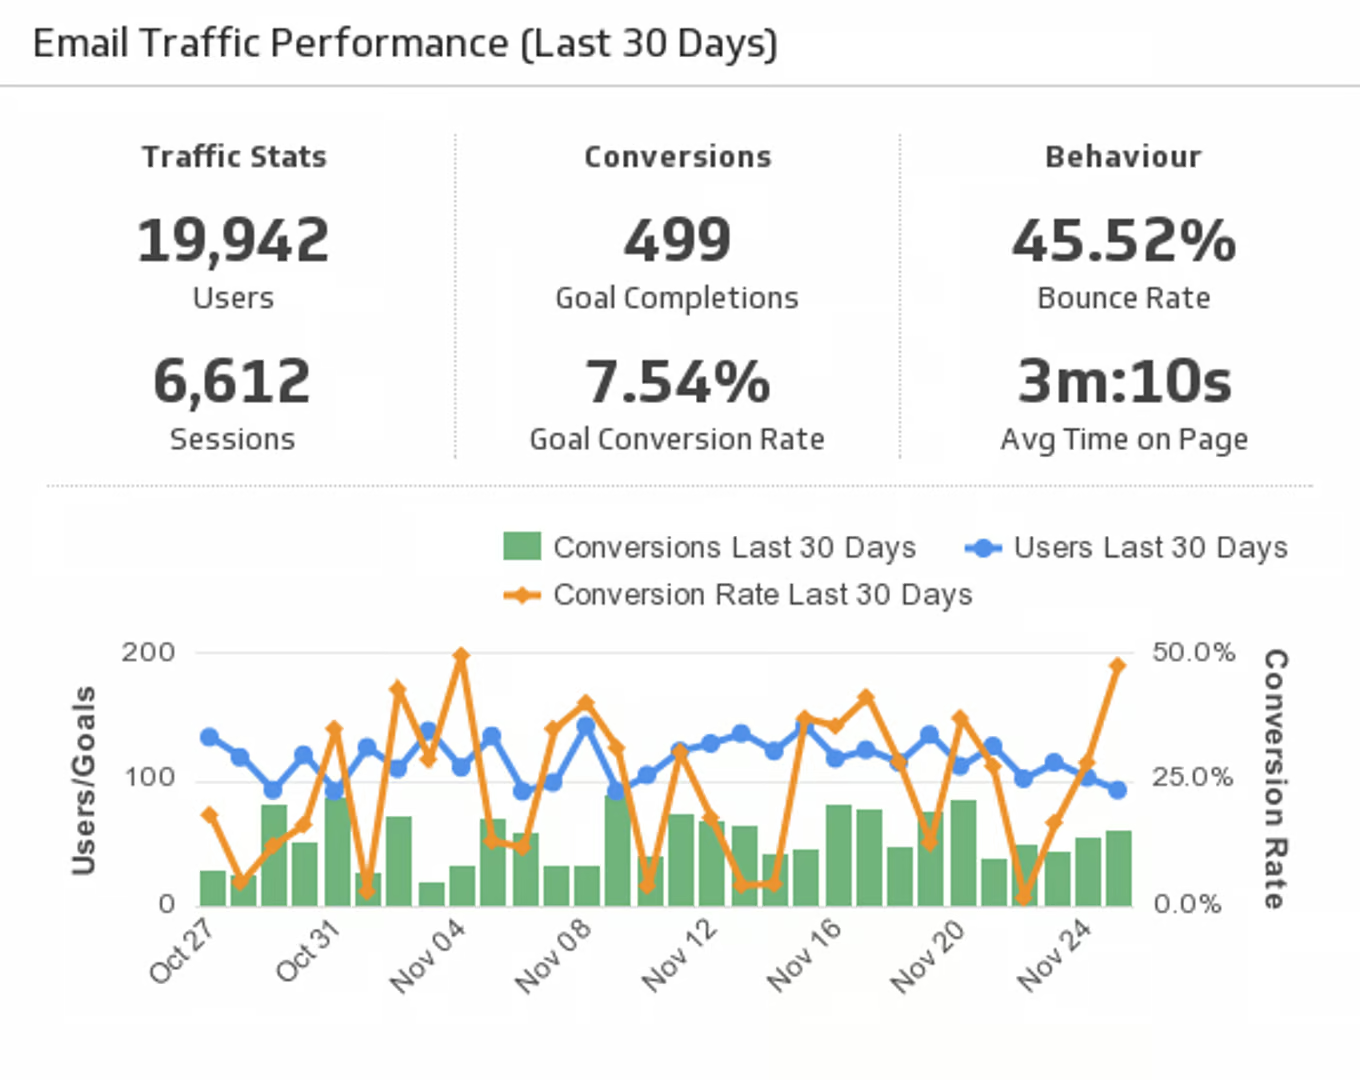
Goal Completions
Goal completions track how often visitors accomplish certain Google Analytics goals, such as signing up for a newsletter or downloading a white paper. Tracking target completions allows you to measure the efficacy of your CTAs and overall content strategy.
Cost Per Conversion
This indicator measures the cost of gaining a conversion. It enables you to determine the return on investment (ROI) of your content marketing activities. Track and optimize cost per conversion using tools like Google Ads and analytics.
Revenue created
The revenue created by content-driven conversions is a direct measure of your content’s impact on the bottom line. Use e-commerce tracking in Google Analytics to link revenue to individual content pieces and adjust your approach accordingly.
#4. SEO Metrics
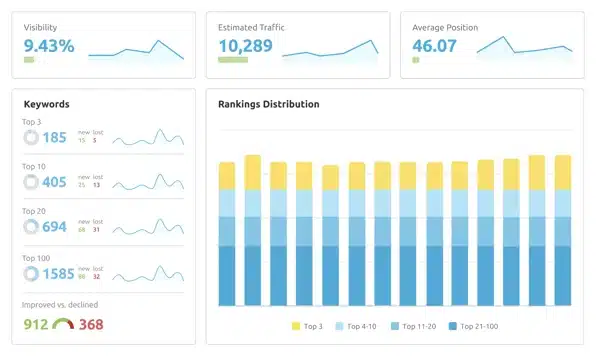
Keyword Rankings
This measure keeps track of where your website ranks in search engine results for specific keywords. Higher rankings often result in more traffic. Use tools like Ahrefs or SEMrush to track keyword rankings and tweak your content for increased search visibility.
Organic Search Traffic
This measure displays the number of visitors who came to your site via search engines. It measures how effectively your SEO efforts are driving traffic. Track organic search traffic using Google Analytics and adjust your SEO approach based on performance.
Backlinks
Backlinks are external links that lead to your content. High-quality backlinks might help your SEO by increasing domain authority. Use tools like Ahrefs to track backlinks and seek new possibilities to build them.
Domain Authority
Domain authority indicates how well a website will rank in search engines. Things like the quantity and caliber of backlinks have an impact on it. Moz is a tool that can help you measure and increase your domain authority.
Page Authority
Page authority forecasts whether a certain page will rank in search engines. It functions similarly to domain authority but focuses on individual pages. Use Moz to track and optimize page authority.
#5. Social Media Metrics
Shares
The number of times your content is shared on social media platforms reflects its perceived worth to the audience. High share counts indicate engaging and valuable content. Use social media analytics tools, such as Buffer, to track shares.
Likes
On social media, likes are a basic measure of content acceptance. While not as useful as shares or comments, they do demonstrate audience appreciation. Use platform-specific statistics to keep track of likes.
Comments
Comments show a deeper level of involvement with your content. They indicate that your audience is engaged enough to interact. Monitor comments to determine engagement and obtain feedback.
Social Media Reach
The total number of unique users that have seen your content is measured by reach. It helps you determine the size of your potential audience. Use social media analytics tools to track reach and improve your content distribution strategy.
Engagement Rate
The engagement rate is calculated by dividing the overall engagement (likes, shares, and comments) by the total number of followers. It helps you assess the popularity of your social media content. To calculate engagement rates, use platforms such as Hootsuite or Sprout Social.
#6. Email Marketing Metrics
Open Rate
The percentage of receivers who open your email is measured. It measures the efficacy of your subject lines. To track and increase open rates, use email marketing platforms like Mailchimp.
Click-Through Rate (CTR)
Email CTR counts the percentage of receivers who click on links in your email. A high CTR indicates interesting email content and successful CTAs. Monitor CTR in your email marketing platform.
Bounce Rate

The bounce rate calculates the proportion of emails that were unable to be sent. A high bounce rate could suggest problems with your email list’s quality. Use email marketing tools to track and sanitize your list regularly.
Unsubscribe Rate
This metric measures the percentage of receivers that unsubscribe after receiving an email. A high unsubscribe rate could indicate that your content is not meeting audience expectations. Monitor this metric and change your email approach accordingly.
Conversion Rate
The email conversion rate calculates the proportion of email recipients who take the desired action. Track conversions with your email marketing platform and tweak your content to increase the rate.
#7. Content Quality Metrics
Readability Score
This metric measures how easy your content is to read. A higher readability score indicates that your content is accessible to a larger audience. Use tools like the Hemingway App to measure and enhance readability.
Content Grade
Content grade assesses the overall quality of your content using criteria such as grammar, structure, and relevance. Grammarly and other tools can help you examine and improve the quality of your content.
Content Freshness
This metric measures how recently your content was updated or published. Fresh content typically performs higher in search engines. To preserve the relevancy and performance of your content, update it regularly.
Plagiarism Score
The degree of plagiarism in your content is what determines its originality. Use Copyscape to ensure your content is unique and avoid search engine penalties.
Content-Length
This indicator monitors the number of words in your content. Longer content is more likely to perform well in search engines, but it must also be compelling and useful. Keep track of content length and aim for thorough, high-quality posts.
Read Also: Short Form Content Mastered: Insider Secrets for Creating Viral, Money-Making Posts
#8. Customer Engagement Metrics
Client Lifetime Value (CLV)
CLV evaluates the overall revenue you can expect from a client over their lifetime. It enables you to assess the long-term value of your content marketing initiatives. Use CRM tools to compute and track CLV.
Customer Retention Rate
This metric indicates the percentage of customers that continue to use your service over time. Retention rates are high, indicating that client interaction was successful. Use CRM tools to track and increase retention.
Net Promoter Score (NPS)
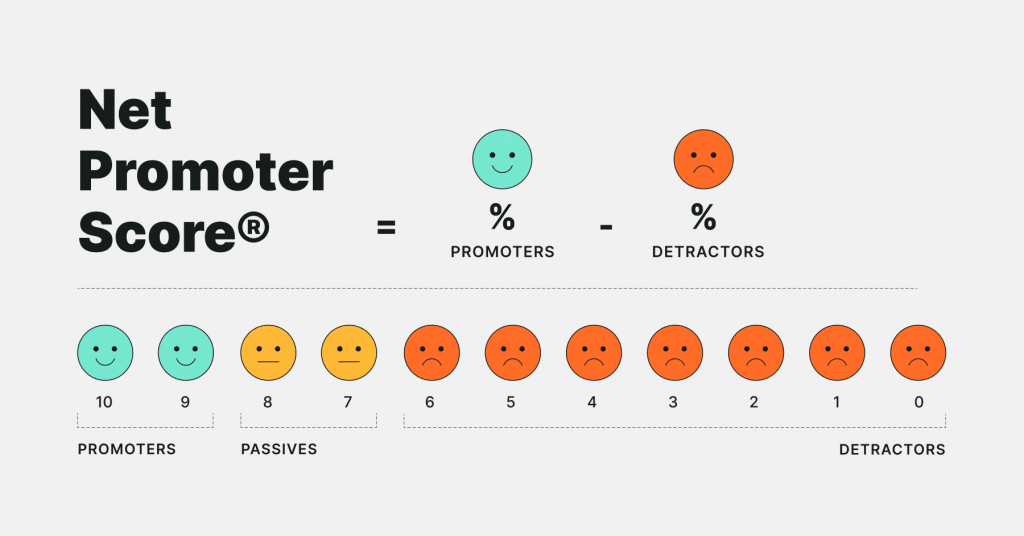
NPS assesses customer satisfaction and loyalty based on their likelihood to suggest your service. Track NPS with customer surveys and utilize the results to improve your content strategy.
Customer Satisfaction Score (CSAT)
CSAT assesses how satisfied customers are with your content or service. Collect customer satisfaction data through surveys and utilize it to find areas for improvement.
Churn Rate
Churn rate is a measure of the percentage of consumers who discontinue utilizing your service during a specific period. A high churn rate could suggest problems with your content or service quality. Utilize CRM technologies to track and reduce turnover.
#9. Content Production Metrics
Content Creation Time
This measure monitors the time it takes to create a piece of content. Use project management tools like Asana or Trello to track and optimize your content creation process. Shortening the production time while preserving quality might boost overall productivity.
Content Frequency
Content frequency is a measure of how frequently you post new content. Consistent publication can help keep audiences engaged and enhance SEO. Use a content calendar to organize and track your publication schedule.
Content Cost
This measure determines the total cost of creating a piece of content, including labor, tools, and other resources. Understanding content prices can help you manage your budget and assess the return on investment for your content marketing activities.
Team Efficiency
Team efficiency is a measure of your content-generating team’s productivity. Monitor job completion times and output quality to find opportunities for improvement. ClickUp is one tool that might help you track team performance.
Content Approval Time
This indicator tracks how long it takes to review and approve content before it is published. Streamlining the approval process can help accelerate content creation and ensure timely publishing.
#10. Video Content Metrics
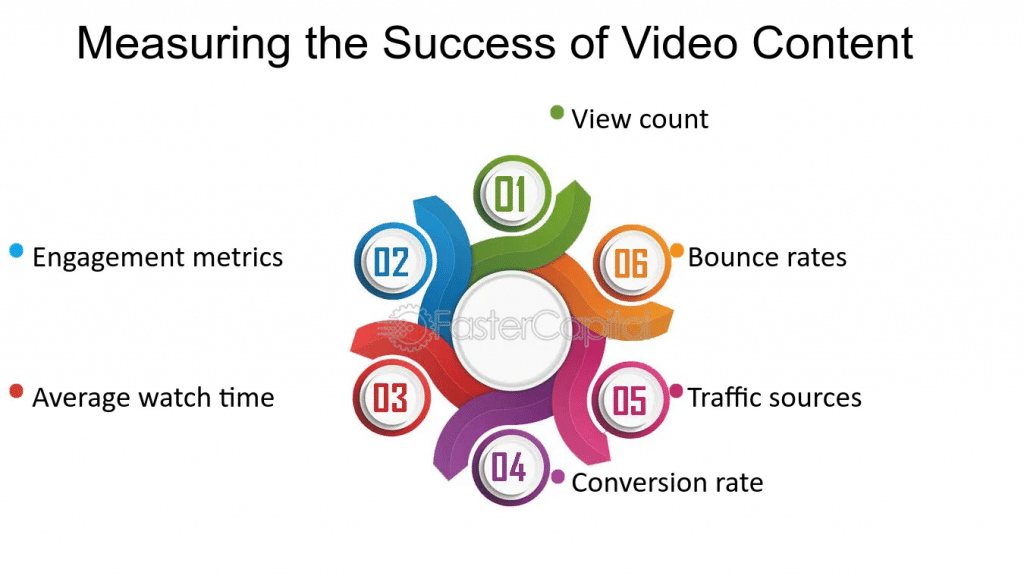
Video Views
This measure keeps track of how many times your video is viewed. High view counts suggest that your content is gaining attention. To measure video views, use YouTube Analytics or Vimeo Analytics.
View-Through Rate
The view-through rate is a measure of how many viewers watch your video all the way through. A high view-through rate indicates that your video content is interesting and keeps viewers interested. Track this metric with YouTube Analytics.
Average View Duration
This metric displays the average time users spend watching your movie. Longer view durations show that viewers value your content. Use video analytics tools to track and optimize view durations.
Engagement Rate
For video content, the engagement rate counts the number of likes, shares, comments, and other interactions with the viewers. A high engagement rate indicates that your audience is actively interacting with your content. Track video engagement with social media analytics tools.
Click-Through Rate (CTR)
The CTR for videos measures the percentage of viewers who click on links or CTAs within your video. A high CTR suggests that your CTAs are intriguing and relevant. Use video analytics tools to measure and increase CTR.
Read Also: How To Calculate Click Through Rate: The ‘Weird’ Industry Trick That Skyrocketed My CTR 473%
Best Tools for Content KPI Tracking
Here are the best tools for tracking content marketing tools;
#1. Google Analytics
Google Analytics is a free tool that offers precise information on website traffic, user behavior, and conversion rates. It tracks metrics such as page views, unique visitors, and bounce rates to help you understand how visitors engage with your website. It works perfectly with other Google technologies, providing for detailed tracking of marketing activities. While it provides reliable statistics, its intricacy can be difficult for newcomers.
#2. SEMrush
SEMrush is an effective SEO tool that includes detailed tools for measuring keyword ranks, organic search traffic, and backlinks. It offers competition research and content improvement recommendations, making it an invaluable tool for enhancing SEO strategy. SEMrush also has tools for content auditing and social media tracking. Despite its high cost, it is popular for providing detailed and actionable insights.
#3. HubSpot
HubSpot is a marketing, sales, and CRM tool that tracks website traffic, leads, and conversion rates. It generates extensive reports on email marketing performance and incorporates CRM to track client interactions. HubSpot also provides social media monitoring and posting solutions. It’s easy to use and offers outstanding customer service, but it costs more.
#4. Ahrefs
Ahrefs is an SEO tool noted for providing detailed information on keyword ranks and backlinks. It provides site audits, content gap analysis, and competitive insights, making it suitable for content planning and optimization. Ahrefs is particularly praised for its reliable backlink data and user-friendly layout. However, its subscription plans are relatively pricey.
#5. Buffer
Buffer is a social media management application that tracks engagement, reach, and growth across numerous platforms. It offers post-scheduling and publishing features, as well as audience demographics and interaction metrics. Buffer is noted for its user-friendly design and reasonable price levels, making it suitable for small and medium-sized organizations. However, it just measures social media metrics.
#6. Sprout Social
Sprout Social provides comprehensive social media management and analytics tools, such as engagement tracking, social listening, and sentiment analysis. It interacts with CRM to track client interactions and generate thorough data on social media performance. Sprout Social is easy to use and provides outstanding customer assistance, but its subscription options are more expensive than competing programs.
#7. Google Data Studio
Google Data Studio is a free data visualization tool that lets you create custom dashboards and reports. It interacts with a variety of data sources, including Google Analytics and Google Ads, to enable real-time data visualization. It is highly customizable and enables simple sharing and collaboration. However, it requires some technical knowledge to set up and is restricted to data visualization and reporting.
#8. Kissmetrics
Kissmetrics measures user behavior and interaction across your website, offering insights into customer journeys and conversion funnels. It provides deep segmentation and cohort analysis and interfaces with a variety of marketing platforms. Kissmetrics is useful for monitoring user behavior and retention, but its membership options are costly, and it offers few social media metrics.
#9. Crazy Egg
Crazy Egg delivers heatmaps and click tracking to help you evaluate user behavior on your website. It provides A/B testing tools and tracks scroll depth and engagement metrics. Crazy Egg is simple to use and helps visualize user behavior, making it ideal for conversion rate optimization. However, it is restricted to website behavior analytics and lacks the full capabilities of all-in-one platforms.
#10. Hootsuite
Hootsuite tracks social media engagement, reach, and follower growth. It offers post-scheduling, publishing tools, social listening, and sentiment analysis. Hootsuite is user-friendly and inexpensive, making it an excellent alternative for managing and analyzing various social media accounts. However, it is confined to social media metrics and offers fewer capabilities than all-in-one solutions.
Using Content Marketing Templates
A content marketing template can help you organize your metrics and track performance more regularly.
Content Marketing Plan Template
Key Takeaways
- Not all metrics are created equal. Concentrate on those that are consistent with your business objectives.
- Effectively track and evaluate your KPIs with tools like Google Analytics and Ahrefs.
- Consistently monitor your metrics to determine what is working and alter your plan as needed.
- You should not be afraid to make mistakes. Learn from them and improve your approach.
- Templates can help you streamline your process and ensure you cover all of the necessary metrics.
Conclusion
Understanding and measuring the appropriate content marketing KPIs and metrics is critical to the success of your campaign. By focusing on the most important metrics, employing analytics tools, and learning from your data, you can make informed decisions that lead to meaningful outcomes. What metrics have been most useful in your content marketing efforts? Share your experiences and let’s learn from one another!
Related Articles
- The Essential Content Marketing Analytics Tools and Metrics to Monitor
- Everything You Need to Know About Content Marketing Tools (Plus Best Picks)
- 11 Share of Voice Tools That is Making Marketing Gurus Rage With Envy
- How To Measure Brand Awareness: KPIs To Look Out For